The invisible queue: why a service slows down before it fills up
Three in the morning. The API p99 went from 120 ms to 400 ms. I look at the graphs and nothing adds up: CPU at 65 %, memory flat, no deploys in six hours, no errors in the logs. Traffic is up 15 %. Everything looks fine and the site is slow.
The first reaction is to hunt for the bug. There is almost never a bug. The dashboard measures what the system does, and the problem is in what the system waits for. Two different things, and only one of them shows up on the graphs.
The sum worth keeping close
Little's Law says L = λ × W. The average number of things inside a system is how many come in per second times how long each one takes to get out.
A coffee shop makes it obvious: if two people walk in per minute and each takes five minutes to order, pay and pick up, there are ten people inside on average. Nothing else is needed. Not how they arrive, not whether the barista is quick.
For a service it turns into something you can use right away: concurrency = throughput × latency. Handling 500 requests per second at 40 ms latency means 20 requests in flight on average. If the connection pool holds 200, the other 180 are serving nobody. They are there to hold queue on the day something goes wrong.
Two of the three numbers give you the third. It is the cheapest way to size a pool.
Being at 80 % does not mean you are 80 % of the way there
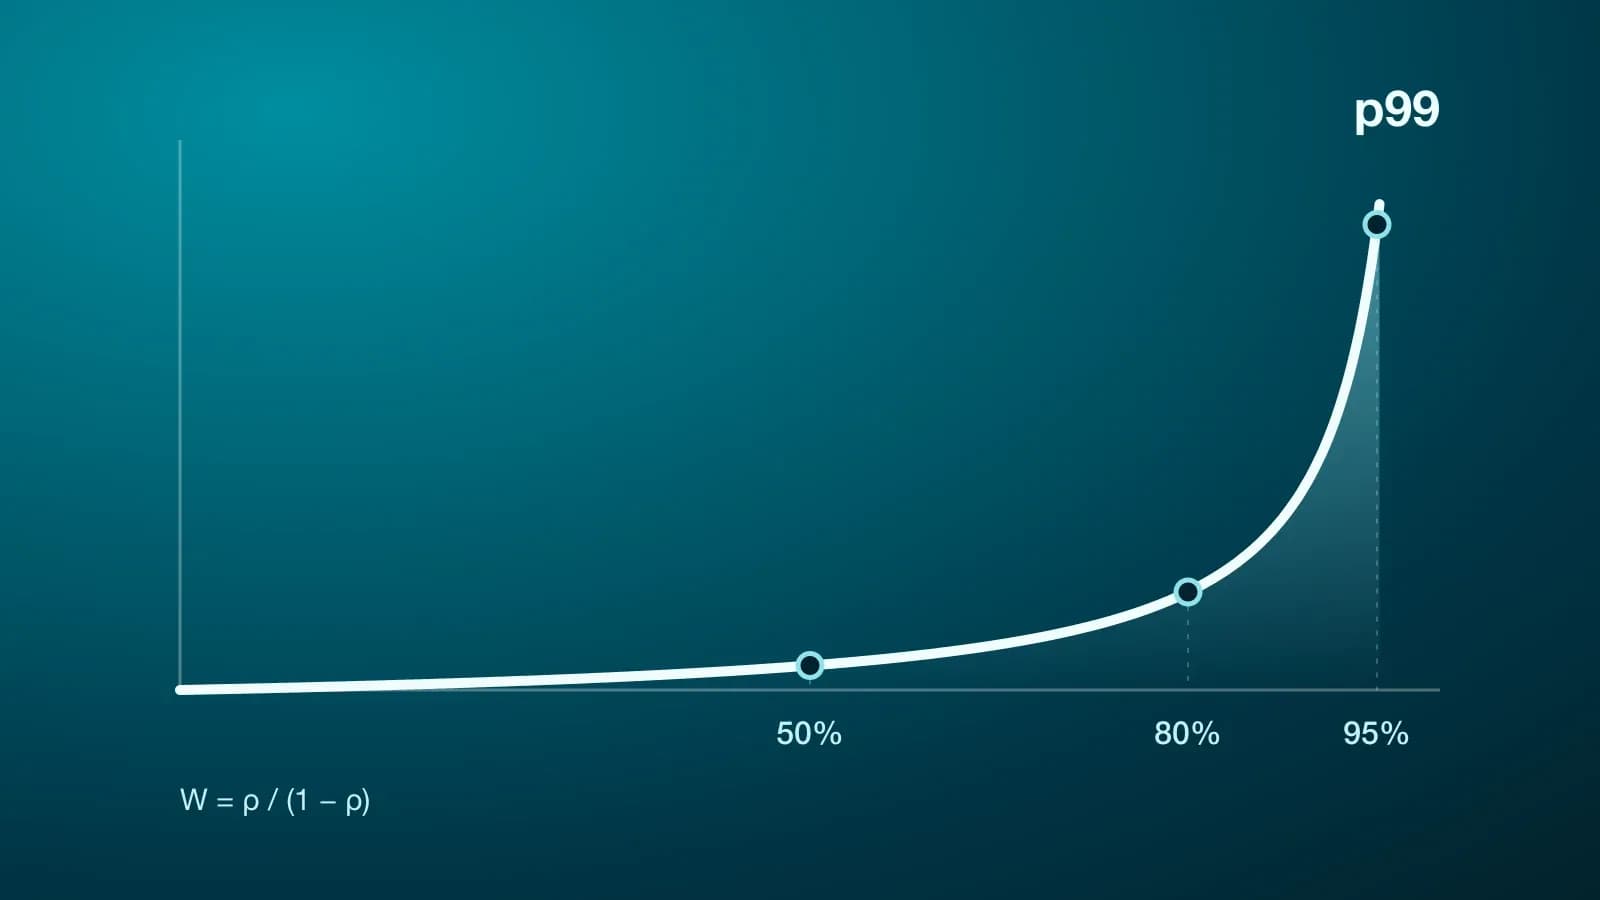
Call utilization (ρ) the fraction of time a resource is busy. In the simplest queue there is, one server and random arrivals, the wait before you get served is Wq = ρ / (1 − ρ) × S, where S is how long the work itself takes.
The whole story lives in that fraction:

From 50 % to 80 %, traffic goes up 60 % and the wait grows fourfold. From 90 % to 95 %, traffic goes up 5 % and the wait doubles again.
The reason shows up if you think about the exact moment: to be served straight away, the resource has to be free right when you arrive, and the odds of that are 1 − ρ. The busier it is, the fewer gaps there are, and everything arriving while work is in progress lines up behind it.
"We are at 70 %, we have 30 % left" is a dangerous sentence. That 30 % is not saved for later: it is what keeps the queue short. You can spend all of it, but you pay in latency and you pay badly.
Variability weighs more than load
The formula above assumes arrivals are evenly spread. Real traffic comes in bursts, and Kingman's formula covers that: Wq ≈ [ρ / (1 − ρ)] × [(ca² + cs²) / 2] × S.
Three things multiplying: how busy the resource is, how much the rhythm varies, and how long the work takes. In factories they call it the VUT equation. We already saw the first factor, the third explains itself, and the middle one is the one nobody measures: ca and cs are how much arrivals and service times vary.
What makes it interesting is that two systems at the same average utilization can wait very different amounts. And the other way round: halve the variability and you halve the wait without touching the infrastructure.
Where does that variability come from in a real system?
- Crons at 00:00 sharp, and retries all firing together after a failure.
- Cold caches after a deploy: the same endpoint goes from 2 ms to 200 ms for a few minutes.
- GC pauses, checkpoints, autovacuums.
- The big customer, with a hundred times more data than the average.
- An N+1 that turns one request into three hundred.
Adding jitter to retries, spreading crons across the minute or capping page size sounds like a minor detail. In practice it pays better than moving up an instance size.
And then it multiplies
So far we have talked about one queue. A request today touches twenty: session, feature flags, database, cache, two or three internal services.

If each call comes back slow one time in a hundred and the request opens twenty, the odds of at least one being slow are 1 − 0.99²⁰, which is 18 %. What is "one in a hundred" for each service is "one in five" for the user.
That is where the line from every postmortem comes from: the median looks perfect and people complain anyway. Your service sets the p50. Every call together sets the p99.
The queues your dashboard skips
The other half of the problem is that the queues are not where you are looking.

Almost every dashboard shows two things: utilization (CPU, memory) and service time (how long the query took, how long the handler took). Neither of them is the wait. When the database says the query took 3 ms and the application says it took 300 ms, those 297 ms are queue. Nearly always, waiting for a free connection.
And watch which utilization you look at. The one that matters belongs to whatever is acting as the plug, not to the machine average. A server at 65 % CPU can have a connection pool at 95 % or a lock at 99 %. The average covers up exactly what is saturated.
What to do
- Measure the wait, not just the service. Two numbers per hop: how long it waited and how long it took. Connection acquisition time from the pool is by far the metric that gives back the most for how little it costs to add.
- Set an explicit concurrency limit. A small pool with a short queue and an aggressive timeout works better than a huge pool. An unbounded queue does not prevent the fall: it swaps fast errors for slow timeouts.
- Shed load early. If the queue goes past what fits in the SLO, return 429 or 503. With Little's Law that is arithmetic and not opinion: if the budget is 200 ms and each request takes 5 ms of server, no more than forty can be waiting.
- Scale on wait or queue size, not on CPU. CPU rises late, falls early, and cannot tell useful work from work that is waiting.
- Cut variability before adding capacity. Jitter, spread crons, percentile-based timeouts, hedged requests (send a copy of the request once you pass p95), batched writes.
- Leave real headroom. Running day to day around 50-70 % of the critical resource is cheaper than it looks: it keeps you on the flat part of the curve.
The same incident, with numbers
Back to the start. A database replica answers queries in 5 ms. At 160 queries per second it sits at 80 %: the wait is 20 ms and total latency 25 ms. Traffic goes up 15 %, to 184 queries per second, and it moves to 92 %: the wait jumps to 57 ms and total latency to 62 ms.
15 % more traffic, two and a half times the latency. And the machine CPU still at 65 %, because the plug was never the CPU. There was no bug to find.
To close
Utilization is not a grade you should push up. It is a lever between what it costs and how long it takes, and it is worth moving on purpose. Every point you take from the headroom you are lending to the queue, and the queue charges interest.
If you want the full trip of a request in plain language, here is what happens between hitting Enter and seeing the page. To keep going on the fan-out side, read "The Tail at Scale" on research.google (Dean and Barroso, 2013), still the best thing written about it. For the variability side, the VUT chapter in Factory Physics by Hopp and Spearman.